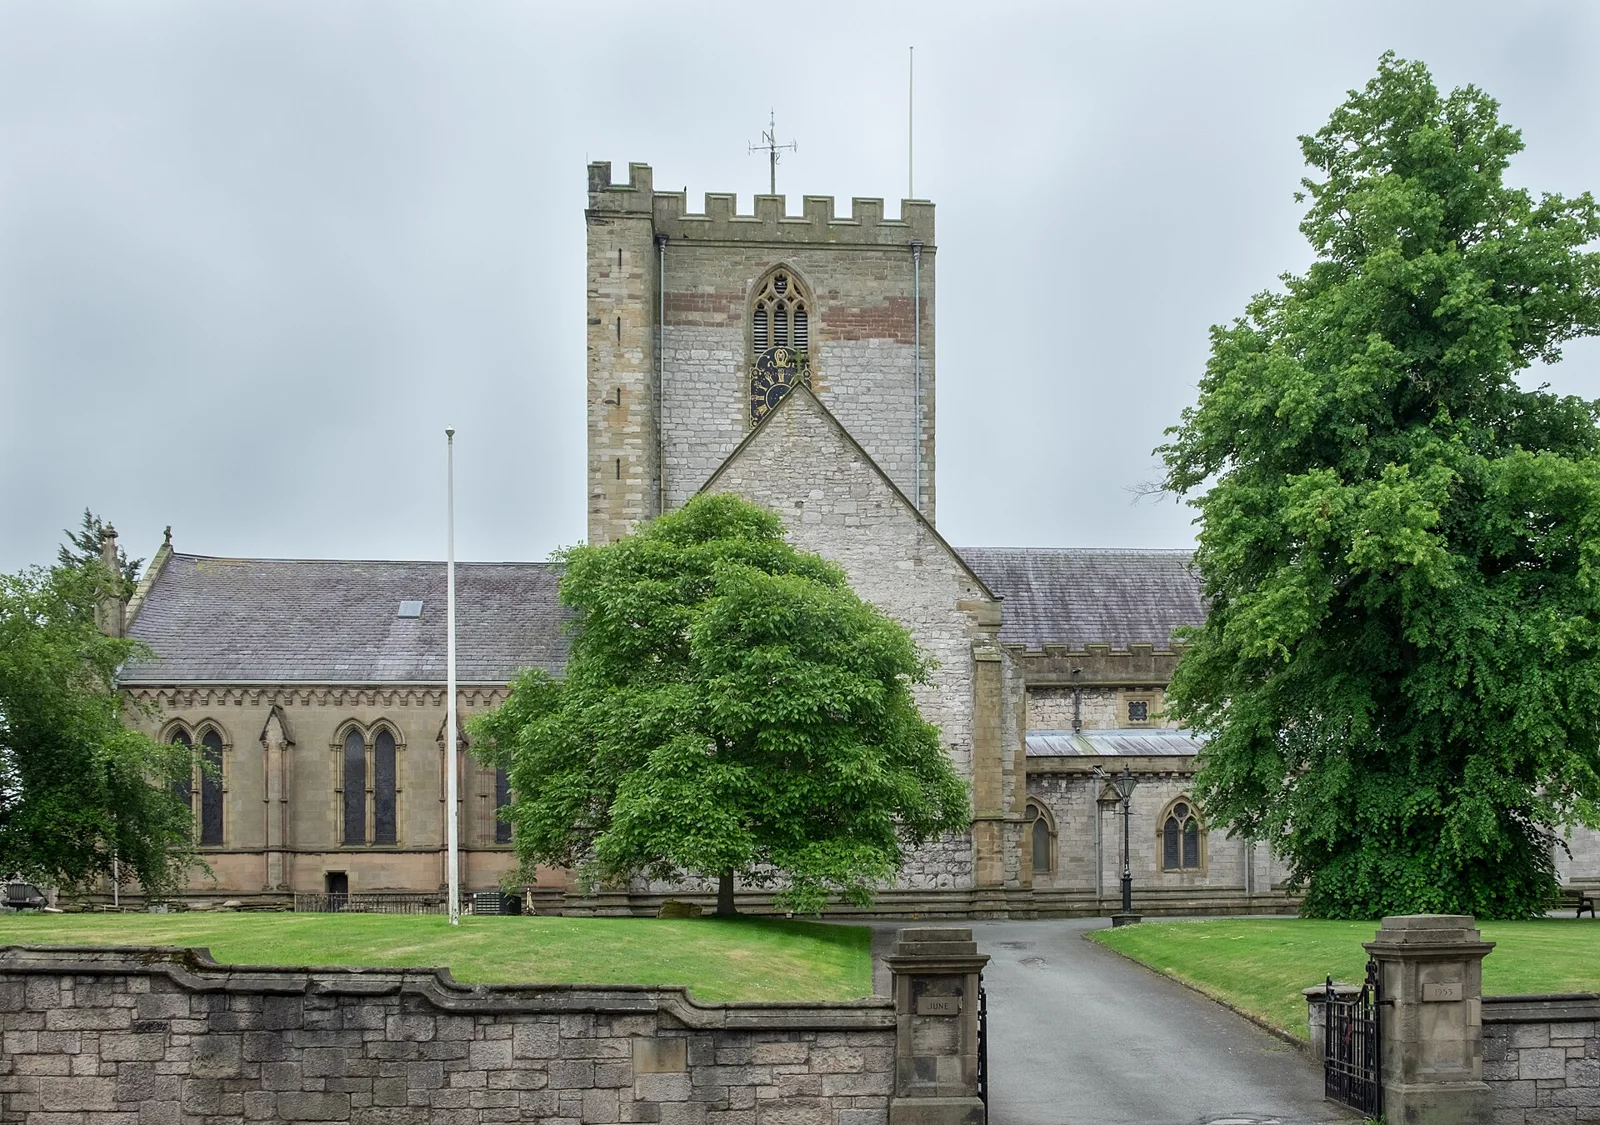
St Asaph is a small cathedral city beside the River Elwy in north Wales. It offers a compact setting that feels quite different from a large urban centre, with the surrounding area forming an important part of its day-to-day connections. Healthcare access is relatively convenient. Outdoor mobile coverage is a weaker aspect of the area.
About this score
The UK index averages 18 supported comparisons. Weather, walking style and your important places need a personal preference and are excluded. Affordability compares supported area prices, with lower prices ranked higher. Crime is compared within each recording nation. Your suitability uses the priorities you choose.
Your home
Homes & affordability
Area data
UK comparison Average
Very poorExcellent
Housing costs sits around the middle of the available comparison against other UK locations.
Data & source
£275,271 supported area price
local sold sample
HM Land Registry completed sales, transaction-weighted local sample; not an asking price or property valuation
Lower area prices. The comparison bar shows relative position, not a guarantee for an individual property.
Flood screening
Area data
UK comparison Very poor
Very poorExcellent
Area flood screening compares less favourably against other UK locations. Individual property flood risk still needs checking.
Data & source
100/100 exposure index (lower means less screened exposure)
Official settlement-centre screen; check surface water and the property
NRW Flood Map for Planning rivers/sea: Zone 3 at settlement centre · Official NRW planning zone from graded river/sea map; contains climate-change allowance · settlement centre, not property-level risk; surface water not included in comparable England/Wales score
Compared with supported UK locations. The comparison bar shows relative position, not a guarantee for an individual property.
Council tax
Area data
UK comparison Below average
Very poorExcellent
Local council tax or domestic rates sits around the middle of the available comparison against other UK locations.
Data & source
Denbighshire
£2,347 per year (reference band)
Official 2026/27 authority council tax or NI domestic-rate context
Compared with supported UK locations. The comparison bar shows relative position, not a guarantee for an individual property.
Historic character
Area data
UK comparison Excellent
Very poorExcellent
Listed buildings around the centre contribute to Saint Asaph's historic character. Historic character stands out in the listed-building comparison against other UK locations.
Data & source
58 listed buildings within 1 km
Statutory listing-density context; not period homes for sale
Compared with supported UK locations. The comparison bar shows relative position, not a guarantee for an individual property.
Your surroundings
Low-density surroundings
Area data
UK comparison Poor
Very poorExcellent
The amount of space between buildings is relatively limited against other UK locations.
Data & source
3.5% mapped building footprint within 1 km
OSM building-footprint share within 1 km; mapped built-upness, not a population census or guaranteed privacy
Lower building density. The comparison bar shows relative position, not a guarantee for an individual property.
Everyday essentials
Area data
UK comparison Excellent
Very poorExcellent
Everyday shops are mapped close to the centre of Saint Asaph. Access to shops is particularly convenient against other UK locations.
Data & source
0.2 km straight-line
OSM nearest grocery / everyday food shop, straight-line proximity, no count bonus
Compared with supported UK locations. The comparison bar shows relative position, not a guarantee for an individual property.
Outdoors & walking
Mapped paths & terrain
Fewer mapped pathsMore mapped paths
There are plenty of mapped paths around Saint Asaph, but some may be urban rather than countryside walks.
Data & source
54.9 km of mapped paths within 3 km
3.5% building footprint; rural character affects countryside-walk fit
Mapped path length within 3 km. Select parks, countryside, hills or mountains to assess your preferred type of walking.
Mapped paths are not necessarily countryside paths. Building density and hill or mountain access are used only when those walking preferences are selected.
Air quality
Area estimate
UK comparison Good
Very poorExcellent
Air-quality evidence sits around the middle of the available comparison against other UK locations.
Data & source
5 μg/m³ PM2.5
Defra/Ricardo Pollution Climate Mapping 2024 modelled PM2.5 + NO2 at 1-km background grid; not roadside/property measurement
Compared with supported UK locations. The comparison bar shows relative position, not a guarantee for an individual property.
Dark skies
Partial evidence
UK comparison Poor
Very poorExcellent
The night-light comparison suggests brighter surroundings against other UK locations.
Compared with supported UK locations. The comparison bar shows relative position, not a guarantee for an individual property.
Getting around
Your important places
Add your places
Add the places you want to stay close to.
Add the places you regularly need to reach and compare the journeys from here.
Data & source
Distances use your selected destinations.
Rail connections
Area estimate
UK comparison Average
Very poorExcellent
Rail access sits around the middle of the available comparison against other UK locations.
Data & source
Rhyl
13 min modelled road/ferry access
8.8 km on the road model
Static road/ferry model; excludes traffic and ferry waits.
Colwyn Bay: 9 min published direct train journey
Llandudno Junction: 16 min published direct train journey
Directed OSM static road/ferry model to up to three distinct mapped stations; inverse-distance-weighted network minutes, no traffic, waits or service-frequency guarantee; supplementary 20% verified service: 2026 Oct GB national-rail or Northern Ireland published timetables; station frequency/direct destinations and published train journey times, combined with V13 static road/ferry model to station; no live journey guarantee
Compared with supported UK locations. The comparison bar shows relative position, not a guarantee for an individual property.
Passenger airports
Area estimate
UK comparison Below average
Very poorExcellent
Airport access sits around the middle of the available comparison against other UK locations.
Data & source
Liverpool John Lennon Airport
71 min modelled road/ferry access
79.0 km on the road model
Static road/ferry model; excludes traffic and ferry waits.
Directed OSM static road/ferry model to up to three distinct OurAirports scheduled-service airports; inverse-distance-weighted network minutes, no traffic, waits or service-frequency guarantee; supplementary 20% verified service: CAA UK airport passenger reporting, 2025 total passenger traffic and scheduled international routes; not a live airline timetable
Compared with supported UK locations. The comparison bar shows relative position, not a guarantee for an individual property.
Major-road access
Area data
UK comparison Very good
Very poorExcellent
A major route is relatively close on the mapped road network. Major-road access compares favourably against other UK locations.
Data & source
Motorway junction / primary A-road
1 min estimated drive
0.2 km on the road model
Recorded road-network distance; time estimated at 40 km/h, excluding traffic.
V17 road reference loading
Compared with supported UK locations. The comparison bar shows relative position, not a guarantee for an individual property.
Everyday life
Schools nearby
Area estimate
UK comparison Excellent
Very poorExcellent
School access rates well against other UK locations. Admissions and individual catchments still need checking.
Data & source
0.3 km straight-line
National inspections retained in original form; rating measures school access
Measured nearest-school proximity only. Scotland/Wales/NI inspectorates are not converted into Ofsted grades.
School access and comparable published inspections. The comparison bar shows relative position, not a guarantee for an individual property.
Healthcare access
Area data
UK comparison Excellent
Very poorExcellent
Healthcare proximity compares well against other UK locations.
Data & source
PEN Y BONT SURGERY
0.3 km straight-line
1.1 km to mapped hospital
50% registered NHS GP proximity, 35% mapped hospital proximity, 15% mapped pharmacy proximity; public postcode centroids / OSM, not capacity or clinical quality
Compared with supported UK locations. The comparison bar shows relative position, not a guarantee for an individual property.
Lower recorded crime
Area data
National comparison Poor
Very poorExcellent
Recorded crime levels compare less favourably within its recording nation (Wales). This is a comparison of recorded crime, not a street-level safety assessment.
Data & source
86.1 recorded crimes per 1,000 residents
2025-09 to 2026-08
Police.uk 2.6 km population-adjusted observed screening, with a 5 km surrounding estimate from overlapping nearby observations (not a separate recorded five-kilometre count)
Compared within the same recording nation. The comparison bar shows relative position, not a guarantee for an individual property.
Eating & drinking
Area data
UK comparison Very good
Very poorExcellent
Mapped eating and drinking options are close to the centre. Places to eat and drink are comparatively accessible against other UK locations.
Data & source
0.1 km straight-line
OSM nearest pub, café or restaurant; proximity, not ratings or opening hours
Compared with supported UK locations. The comparison bar shows relative position, not a guarantee for an individual property.
Lifestyle & future
Coastal access
Area data
UK comparison Very good
Very poorExcellent
Coastal access is a clear relative advantage against other UK locations.
Data & source
4.1 km to coastline
Mapped coastline distance; straight-line distance, not a route
Compared with supported UK locations. The comparison bar shows relative position, not a guarantee for an individual property.
Weather & climate
Observed weather
Cooler / wetterWarmer / drier
The recorded weather describes local conditions. Whether these suit you depends on the climate you prefer.
Data & source
11.5°C mean temperature
640 mm rainfall
1,620 sunshine hours
Met Office observations for the recorded 12-month period, not long-term normals. This range combines observed temperature, rainfall and sunshine; it is not a good/bad rating.
Broadband
Area data
UK comparison Average
Very poorExcellent
Broadband provision sits around the middle of the available comparison against other UK locations.
Compared with supported UK locations. The comparison bar shows relative position, not a guarantee for an individual property.
Mobile coverage
Area estimate
UK comparison Poor
Very poorExcellent
Outdoor mobile coverage compares less favourably against other UK locations. Indoor reception may differ from the area estimate.
Data & source
Outdoor coverage across the local authority
Ofcom Jan 2026 outdoor geographic coverage (at least one network), published by ONS Explore Local Statistics; local-authority area, NOT a village or indoor signal reading
Compared with supported UK locations. The comparison bar shows relative position, not a guarantee for an individual property.
Employment context
Area data
UK comparison Below average
Very poorExcellent
The employment picture sits around the middle of the available comparison against other UK locations.
Data & source
73.7% working-age employment
0.9 jobs per working-age resident
ONS/NISRA labour conditions: 65% workplace job-density fit + 35% working-age employment fit when both exist; otherwise published component only. Survey uncertainty; not vacancies or an individual job match
Area employment and job availability. The comparison bar shows relative position, not a guarantee for an individual property.